sf.apps.data.TaceAs
-
class
TaceAs[source]¶ Bases:
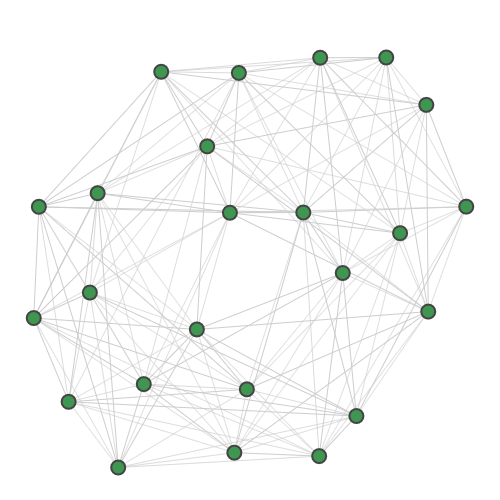
strawberryfields.apps.data.sample.GraphDatasetBinding interaction graph for the TACE-AS complex [9].
Nodes in this graph correspond to pairs of atoms in a target protein and a pharmaceutical molecule. Edges in the graph are added if the distance between both pairs of atoms is very close to equal. Cliques in the graph correspond to possible docking configurations of protein and molecule, and the largest clique is the most stable configuration. There are multiple maximum-sized cliques of 8 nodes in this graph.
Graph:
-
n_mean = 8
-
threshold = True
-
n_samples = 50000
-
modes = 24
Attributes
Methods
counts([axis])Count number of photons or clicks.
-
counts(axis=1)¶ Count number of photons or clicks.
Counts number of photons/clicks in each sample (
axis==1) or number of photons/clicks in each mode compounded over all samples (axis==0).- Parameters
axis (int) – axis to perform count
- Returns
counts from samples
- Return type
list
-