sf.apps.plot.spectrum
-
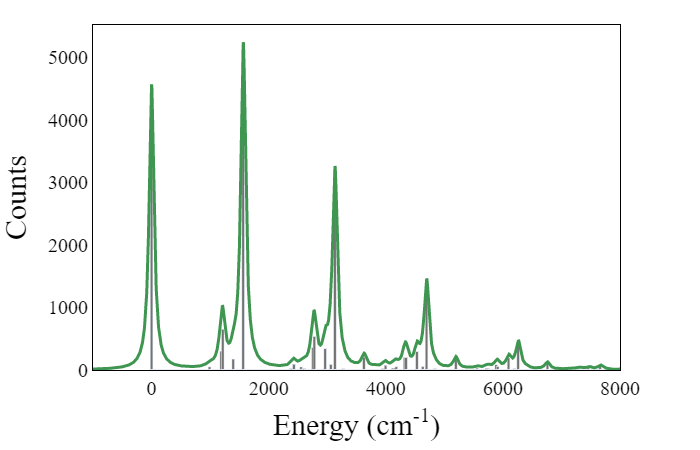
spectrum(energies, gamma=100.0, xmin=None, xmax=None)[source]¶ Plots a vibronic spectrum based on input sampled energies.
Example usage:
>>> formic = data.Formic()
>>> e = qchem.vibronic.energies(formic, formic.w, formic.wp)
>>> full_spectrum = plot.spectrum(e, xmin=-1000, xmax=8000)
>>> full_spectrum.show()
- Parameters
energies (list[float]) – a list of sampled energies
gamma (float) – parameter specifying the width of the Lorentzian function
xmin (float) – minimum limit of the x axis
xmax (float) – maximum limit of the x axis
- Returns
spectrum in the form of a histogram of energies with a Lorentzian-like curve
- Return type
Figure
code/api/strawberryfields.apps.plot.spectrum
Download Python script
Download Notebook
View on GitHub