sf.apps.plot.points
-
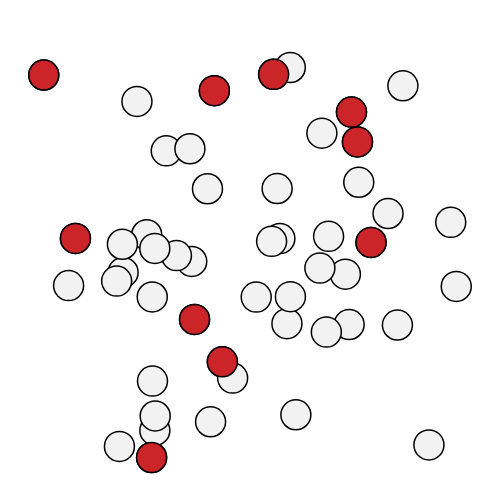
points(R, sample=None, plot_size=(500, 500), point_size=30)[source]¶ Creates a plot of two-dimensional points given their input coordinates. Sampled points can be optionally highlighted among all points.
Example usage:
>>> R = np.random.normal(0, 1, (50, 2))
>>> sample = [1] * 10 + [0] * 40  # select first ten points
>>> plot.points(R, sample).show()
- Parameters
R (np.array) – Coordinate matrix. Rows of this array are the coordinates of the points.
sample (list[int]) – optional subset of sampled points to be highlighted
plot_size (int) – size of the plot in pixels, given as a pair of integers
(x_size,
y_size)
point_size (int) – size of the points, proportional to its radius
- Returns
figure of points with optionally highlighted sample
- Return type
Figure
code/api/strawberryfields.apps.plot.points
Download Python script
Download Notebook
View on GitHub