GBS datasets
Technical details are available in the API documentation: sf.apps.data
Strawberry Fields contains datasets of pre-generated samples from GBS for encoded problems, including graphs for graph optimization and machine learning problems, and molecules for calculating vibronic spectra.
Graphs
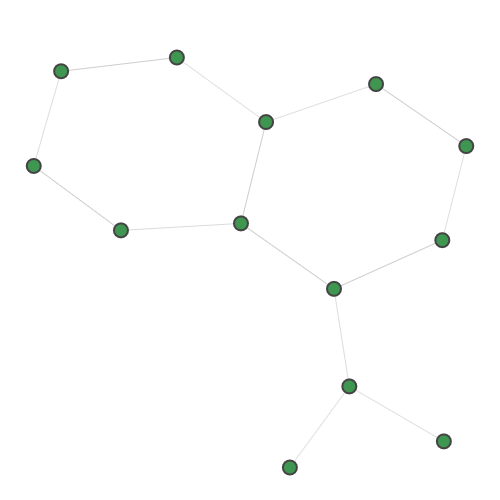
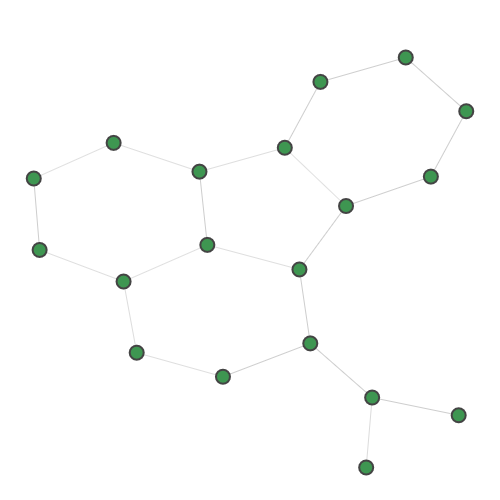
For dense subgraph and maximum clique identification, we provide:
Planted |
TACE-AS |
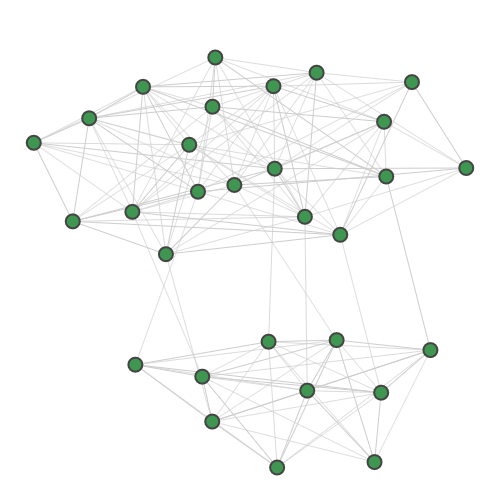
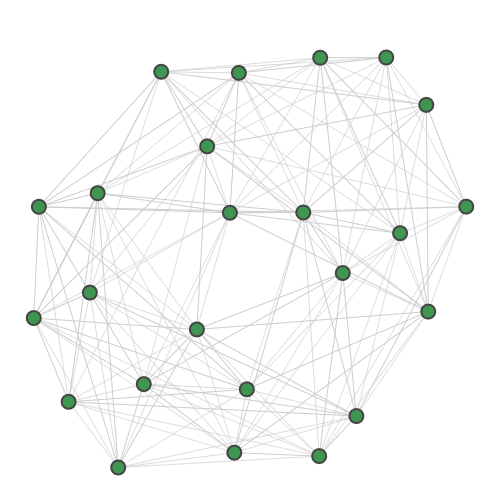
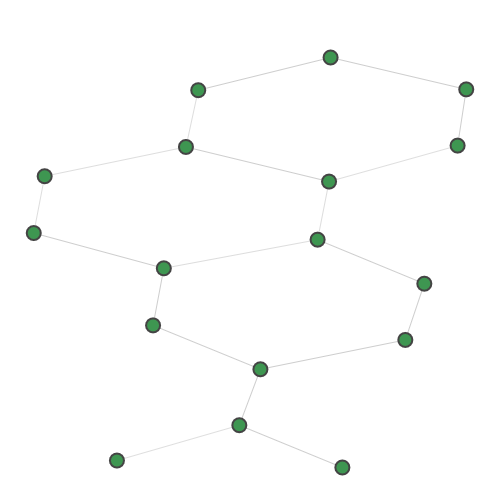
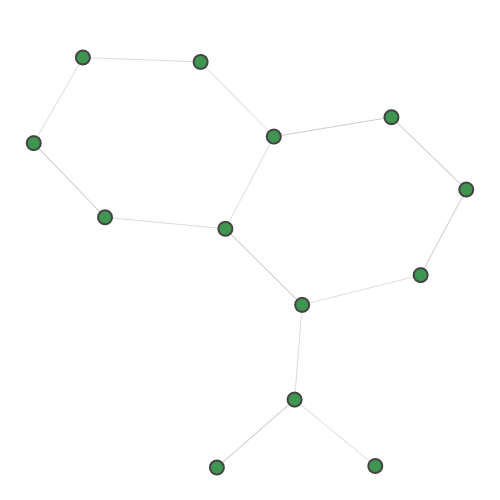
A random 30-node graph containing a dense 10-node subgraph planted inside [5]. Binding interaction graph for the TACE-AS complex [9]. Random graph created using the p-hat generator of [4]. For graph similarity, we provide: MUTAG_0 MUTAG_1 MUTAG_2 MUTAG_3 First graph of the MUTAG dataset. Second graph of the MUTAG dataset. Third graph of the MUTAG dataset. Fourth graph of the MUTAG dataset. Additionally, pre-calculated feature vectors of the following graph datasets are provided: Exactly-calculated feature vectors of the 188 graphs in the MUTAG dataset. Exactly-calculated feature vectors of 1100 randomly-chosen molecules from the QM9 dataset. Monte-Carlo estimated feature vectors of 1100 randomly-chosen molecules from the QM9 dataset. Using the Zero temperature formic acid. Vibrational dynamics of the water molecule. Vibrational dynamics of the pyrrole molecule. The Each dataset contains a variety of metadata relevant to the sampling: Graph and molecule datasets also contain some specific data, such as the graph adjacency matrix
or the input molecular information. Note that datasets are simulated without photon loss. We use the Simply use indexing and slicing to access samples from the dataset: Datasets also contain metadata relevant to the GBS setup: The number of photons or clicks in each sample is available using the
For example, we see that the
Planted()TaceAs()PHat()
Mutag0()Mutag1()Mutag2()Mutag3()
MUTAG()QM9Exact()QM9MC()Molecules
vibronic module and sample() function, GBS data has
been generated for formic acid at zero temperature. The GBS samples can be used to recover the
vibronic spectrum of the molecule.
Formic()Water(t)Pyrrole(t)Dataset
SampleDataset class provides the base functionality from which all datasets inherit.
n_mean: theoretical mean number of photons in the GBS devicethreshold: flag to indicate whether samples are generated with threshold detection or
with photon-number-resolving detectorsn_samples: total number of samples in the datasetmodes: number of modes in the GBS device or, equivalently, number of nodes in the graphdata: the raw data accessible as a SciPy csr sparse arrayLoading data
Planted class as an example to show how to interact with the datasets. Datasets
can be loaded by running:>>> data = Planted()
>>> sample_3 = data[3]
>>> samples = data[:10]
>>> data.n_mean
8
>>> len(data)
50000
counts() method:>>> data.counts()
[2, 0, 8, 11, ... , 6]
data[3] sample has 11 clicks.