sf.apps.plot.graph
-
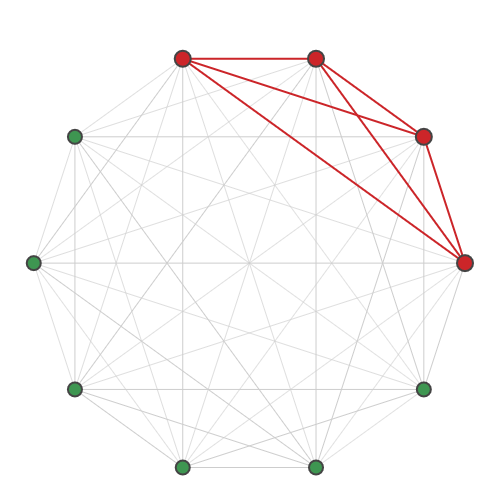
graph(g, s=None, plot_size=(500, 500))[source]¶ Creates a plot of the input graph.
This function can plot the input graph only, or the graph with a specified subgraph highlighted. Graphs are plotted using the Kamada-Kawai layout with an aspect ratio of 1:1.
Example usage:
>>> graph = nx.complete_graph(10)
>>> fig = plot.graph(graph, [0, 1, 2, 3])
>>> fig.show()
- Parameters
g (nx.Graph) – input graph
s (list) – optional list of nodes comprising the subgraph to highlight
plot_size (int) – size of the plot in pixels, given as a pair of integers
(x_size,
y_size)
- Returns
figure for graph and optionally highlighted subgraph
- Return type
Figure
code/api/strawberryfields.apps.plot.graph
Download Python script
Download Notebook
View on GitHub